Have you ever driven around on autopilot? The stark truth is that we all have. Possibly even day dreaming into a school zone at above the specified speed limit! Although the majority of good citizens have the intention of doing the right thing, momentary lapses of awareness can contribute to an increased risk of serious harm to school children, if a vehicle impact should occur.
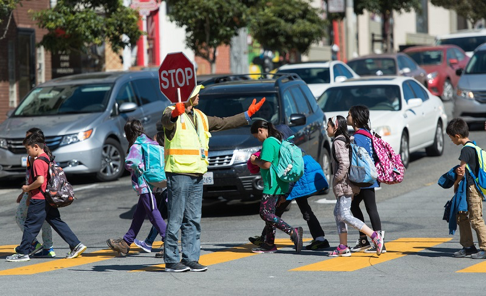
Although school speed advisory signs help with awareness and flashing lights may help grab attention, these are a one way communication medium. In contrast, a school crossing assistant creates a form of dialogue, as they visually and non-verbally interact with drivers to bring them to a stop or advise when it is safe to pass. It is this interactivity that creates a connection to the driver, resulting in a two way exchange between notification and behaviour.
With this in mind, how can technology be embraced to create interactivity with drivers around school zones? In particular the creation of an engaging connection with vehicle operators through two way communication. One that will advise speed limits, provide feedback and encourage compliance.
The Benefit of Reducing Speed
Reduction of speed around school zones can have a significant effect on the likelihood of a fatality due to a vehicle-pedestrian impact. The reduction of speed from 60 km/h to 50 km/h can create a 48% lower risk of fatality1. Whereas with Australia’s 40 km/h school zones, a vehicle travelling at 45 km/h is six times more likely to result in a fatality than travelling at 37 km/h, which reduces the risk of a fatality due to an impact to only 10% (see Figure 1). This highlights the importance of reducing vehicle speeds to 40 km/h or lower. Emphasising that travelling ‘just above’ the speed limit is simply not good enough.
The Psychology of Attention
Numerous studies have shown that a variety of road safety interventions have had a significant impact on a driver’s intention to comply with directions and behaviour3. Notably, traffic control devices that include flashing beacons have been shown to be more effective than those without4. With special attention to indicating school zones with flashing beacons at the beginning and end of the zone improving compliance5. Be that as it may, reducing vehicle speeds to 40 km/h or below may require an additional ‘critical’ layer of attention to speed. Facilitating the finite reduction in speed that will lower the risk of fatality around our children.
Speed Monitoring Devices
Although speed cameras can use fear to negatively motivate compliance. Acute awareness of speed in relation to posted speed limits has been found to play a key role regarding the intention to speed6. This is where a speed monitoring device (SMD) can provide accurate feedback to drivers on their individual vehicle’s speed. Markedly, SMDs have been shown to have a positive impact on speed reduction, resulting in an average 15% reduction in speed at SMD locations7.
Although a driver’s attention may have been captured with the help of flashing beacons and subsequently having been notified of the speed limit. A speed monitoring device; being interactive in nature, can now provide real-time accurate feedback to encourage behaviour modification. A compliance behaviour that others may also notice, but how?
Perception of Social Pressure
The likelihood of experiencing a positive or negative outcome as a result of performing a behaviour can influence the degree of value someone places on their willingness to comply2. This is where the perception of social pressure to perform or not perform a behaviour, plays a supplementary and key role in thwarting a driver’s intention to speed … however minor that variation may be5.
With this in mind, the visibility to others of a vehicles’ speed, captured through a SMD. Along with feedback that is projected on an integrated variable message sign (VMS), draws attention to an individual’s compliance or non-compliance to others. Creating pressure from the perception of social comparison and implied surveillance8.
Rewarding Behaviour
In addition to the perception of social comparison, the probability of compliance is associated with the likelihood of experiencing either positive or negative outcomes, as a result of performing the behaviour2. We have all heard the analogy of the carrot and the stick. The recognition of compliance or non-compliance rounds off the script in the form of either a gratifying message such as THANK YOU or a disciplinary message such as SLOW DOWN. Creating a reward dynamic for drivers in direct relation to their behaviour.
Automated and/or Static Signage
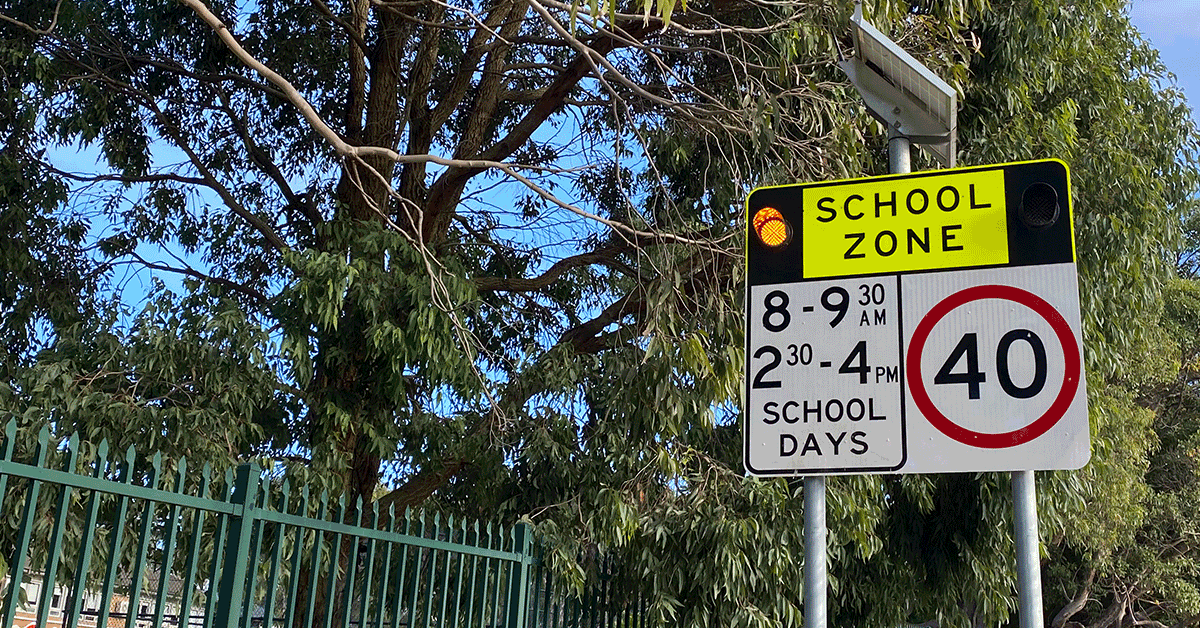
Currently, the majority of school zone signs in Australia are automated and/or static in nature. Simply notifying drivers of the time period of the school zone and speed limit of 40 km/h. An inherent problem with static only signage is the additional requirement for a driver to check the time. Along with the hope that the sign has actually captured the drivers attention to initiate compliance in the first place.
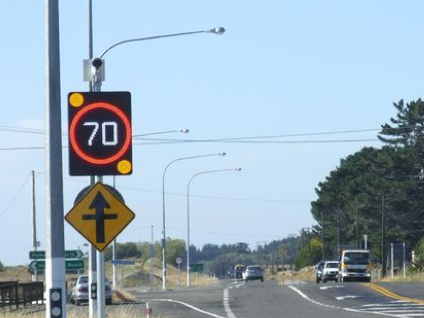
Dynamic Speed Monitoring Devices
On the other hand, dynamic speed monitoring devices combined with flashing beacons, real-time feedback and variable message displays have been shown to dramatically influence driver behaviour on many levels as discussed. Encompassing a comprehensive script to capture attention, create awareness, provide feedback, encourage behaviour modification and reward compliance.
Given these points, interactive traffic control measures such as speed monitoring devices and dynamic signage can significantly enhance the awareness of speed around school zones. Incorporating a complete system that encourages compliance on many levels, resulting in a decreased risk of serious injury or fatality from a vehicle impact. In essence, by embracing technology we can create that extra layer of protection to keep our kids safe.
By Garry Taylor
Armitage Group
[1]Anderson, R.W.G., McLean, A.J., Farmer, M.J.B., Lee, B.H. and Brooks, C.G., 1997. Vehicle travel speeds and the incidence of fatal pedestrian crashes. Accident Analysis & Prevention, 29(5), pp.667-674.
[2]Derived from the Interdisciplinary Working Group for Accident Mechanics (1986) and Walz, F. H., Hoefliger, M. and Fehlmann, W. (1983) Speed limit reduction from 60 to 50 km/h and pedestrian injuries. In Twenty-Seventh Stapp Car Crash Conference Proceedings with International Research Council on Biokinetics of Impacts (IRCOBI), pp. 311–318.
[3]Elliott, MA & Armitage, CJ 2009, ‘Promoting drivers’ compliance with speed limits: Testing an intervention based on the theory of planned behaviour’, British Journal of Psychology, vol. 100, no. 1, pp. 111–132.
[4]Hawkins Jr, H.G., 2007. Rear-facing school speed limit beacons. Institute of Transportation Engineers. ITE Journal, 77(6), p.18.
[5]Rose, E.R., Hawkins Jr, H.G., Holick, A.J. and Bligh, R.P., 2004. Evaluation of traffic control devices: first year activities (No. FHWA/TX-05/0-4701-1,).
[6]Parker, D., Manstead, A.S., Stradling, S.G., Reason, J.T. and Baxter, J.S., 1992. Intention to commit driving violations: An application of the theory of planned behavior. Journal of applied psychology, 77(1), p.94.
[7]Lee, C., Lee, S., Choi, B. and Oh, Y., 2006. Effectiveness of speed-monitoring displays in speed reduction in school zones. Transportation research record, 1973(1), pp.27-35.
[8]Wrapson, W, Harré, N & Murrell, P 2006, ‘Reductions in driver speed using posted feedback of speeding information: Social comparison or implied surveillance?’, Accident Analysis and Prevention, vol. 38, no. 6, pp. 1119–1126.